

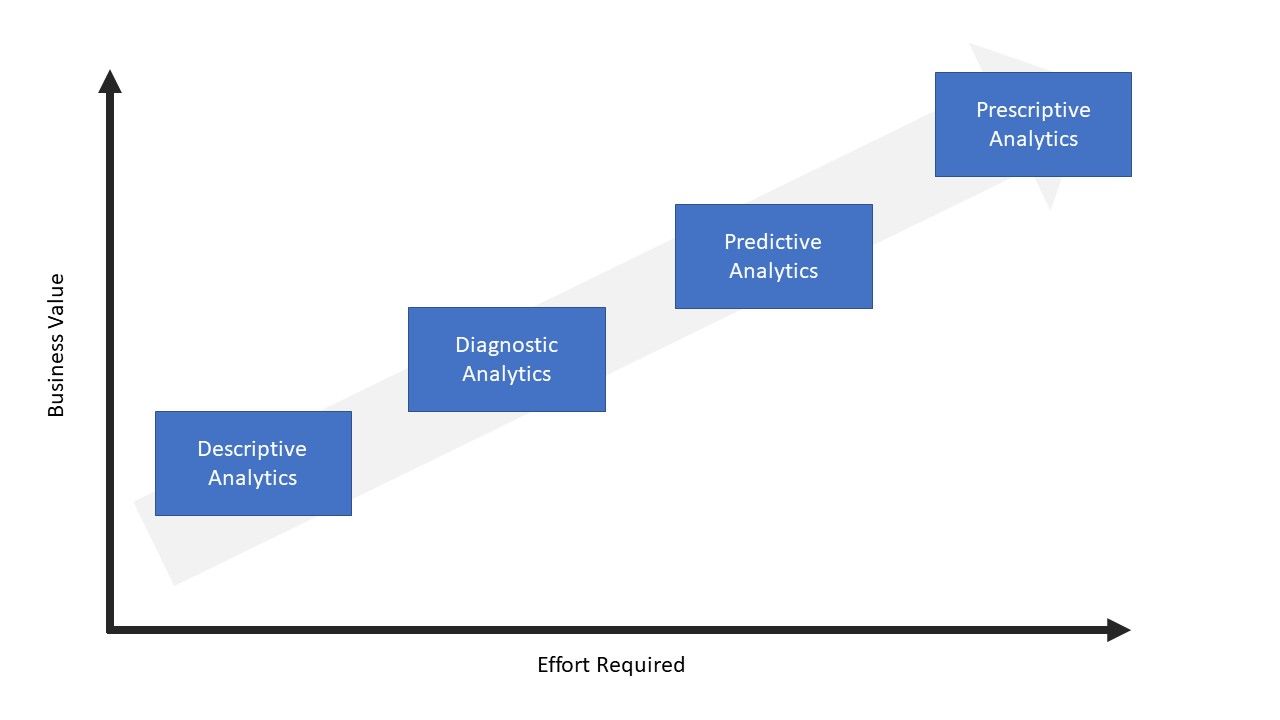
I notice a lot of companies have challenges trying to gain value from the data they have collected. There are many considerations before we can start discussing on gaining value from data, with the main consideration being the quality of data and whether it can answer the business question at hand. However, this will not be the focus of the blog post. What I want to illustrate are the benefits your organization data can present, to serve as motivation. It can be seen as a form of maturity process too, on how organizations can continuously extract value from data. They are known as the 4 levels of Analytics. Here is a popular diagram that puts these 4 levels together.
Descriptive Analytics
The definitive question that Descriptive Analytics answer is, "What has happened?" It looks at the past, to understand how the organization has performed. This is very useful especially if an organization has implemented a campaign and wants to see its performance. For instance, a cross-selling campaign was implemented in Jan 2019 and descriptive analytics can help to track its effectiveness, and from there a decision can be made to determine if the campaign needs to continue or be terminated.
From my observation, many companies are doing it but not doing it well. To do it well, here are the stages.
1) Plan & Design your Performance Metrics
Most businesses are concern with how they are performing in the market and implement campaigns tied to their overall strategy. Given the constraints that ALL businesses faced, they will love to know if they are performing well or their campaigns are performing to expectations. Campaigns that are not performing can be terminated to conserve resources.
Descriptive Analytics allows businesses to understand how they are performing. To ensure the "picture" painted by the metrics is reflecting reality, we need to design performance metrics that measure accurately. For instance, when we want to measure a pulse, we have to put the measuring equipment at the right place. Otherwise, the pulse measurement is not accurate.
2) Determine the Data and its Quality
After the design of performance metrics, it is time to look at the data required to calculate the metrics. Formulas to derive the metrics will need to be determined so that parameters of data can be tweaked to support the calculation.
For instance, in the banks, there are many ways to measure delinquency. If the customer owes the bank for less than a month, will that be considered delinquent? Or only if the customer owes the bank for more than 90 days then it is considered? There will be a consideration because if you set it too strict, your alerts can get triggered easily which means processes need to be activated to assess if the circumstances warrant an action. If you set it too lenient, the bank gets alerted only when the situation is dire and no remedial actions can be taken.
3) Dashboard/Report Design
Businesses do not look at a single metric. To be able to make sense of the data, they need to have several metrics. These metrics need to come together to paint a clear picture on what has happened so far. To achieve a clear picture, businesses will need to design the report or dashboard. This is to allow a side-by-side comparison between the different metrics. Besides having an analyst to write out the analysis, it will be good to give the report reader to make its own analysis too. A well-designed dashboard allows the individual reader to carry out his/her analysis. Self-service analytics will give the data analyst or data scientist more time to work on what is more important, excavating more insights for business.
Diagnostic Analytics
We do not stop at answering "What has happened?". After knowing what has happened so far, we move on to the next stage and that understands the reason for what has happened, "Why did it happen?". This is to allow us to learn from our actions so that success gets repeated and failure can be avoided.
Diagnostic Analytics is not an easy analysis to do. In this stage, there is a strong need for domain knowledge. The analyst needs to understand the business very well, its process, regulations, policies, target market. The analyst is like a sleuth trying to find the reasons.
For instance, a supermarket may see a large drop in the sales of chocolate for the month of July. This is noticed because of Descriptive Analytics. The analyst will then have to investigate why that is the case. It could be because of supply chain issues. Or it could be there is news reports on health issues with eating chocolate (please NEVER EVER make it happen!). You can see from the example, doing Diagnostic Analytics, finding the "why it happened" requires domain knowledge to seek out the possible reasons/hypothesis and eliminate them through further investigation.
To do Diagnostic Analytics well, strength in domain knowledge is important and for that, there needs to be strong cohesion between departments. This gets especially challenging for large corporations because the departments function like silos rather than sharing information across.
Secondly, documentation of lessons learned and investigation done will prove to be useful for any future diagnostic analytics. So do remember to document them down.
Predictive Analytics
Predictive Analytics attempts to answer the question, "What May Happened?". Although from the name it sounds like we are making predictions, that is not really true. In actual fact, for Predictive Analytics, we are looking at using machine learning algorithms (namely Supervised Learning) to discover patterns. What kind of patterns?
We are getting the algorithms to run through the data and discover the relationship between the target (something that we are interested to know in advance) and features (something that we will know before the target becomes concrete/final) i.e. we are trying to use features to determine what the target might be. So the supervised learning model does the following:
- Determine whether there is a relationship.
- What type of relationship?
- Strength of the relationship
Sometimes, you may hear that predictive analytics or machine learning is about "curve-fitting" which is true if you look at the second point above.
You can see predictive analytics like this, there is a mysterious relationship between the feature and the target and it is the job of the data scientist to get as close to the true but mysterious relationship as much as possible. The different machine learning model allows the data scientist to try and model the different relationship, for instance, regression, classifier, etc.
This stage of analytics is not easy as there are many considerations from data all the way to using the final model for decision making. But you can see the value is going to be great because who doesn't want the power to predict? A quick word of caution though, its not really actual predictions that we get but probabilities or estimation most of the time.
Prescriptive Analytics
Prescriptive analytics is more advanced than Predictive Analytics definitely but how advanced? In Predictive Analytics, businesses can use to determine how likely a customer taking up a marketing offer, but Prescriptive Analytics, using mathematical and computational methods to propose the next step, or answers the question, "What is the NEXT BEST step?" It is possible to provide, several options with possible outcomes and businesses determine which is the best option to undertake. Generally, it is a combination of the previous level of Analytics (Descriptive, Diagnostic and Predictive) together with perhaps operation research, game theory (and many more).
Conclusion
Based on my observation, most companies are still figuring out how to take advantage of their data and they started off from Descriptive Analytics through monthly & ad-hoc reporting.
A quick reminder, having existing reporting processes does not mean your organization is taking advantage of data. More important is deriving value from data. If you are not getting insights into your past, not knowing how your business has performed and where are the opportunities and risk, you might want to start doing a re-design of your reports and reporting process.
If you will like to have a discussion on your existing reporting process, consider dropping me a note at my LinkedIn profile. To follow what I am working on, my latest posts and my small thoughts, consider signing up for my newsletter. I look forward to hearing your feedback too! :)